

2026 Local GEO Benchmark Study: AI Search Citation Data
Executive Summary and Primary Research Metrics
This empirical benchmark report analyzes 5,000 localized commercial searches across Google AI Overviews, ChatGPT Search, and Perplexity AI. Conducted between January 15, 2026, and July 30, 2026, this study identifies the primary algorithmic triggers that govern how Large Language Models (LLMs) and generative search engines extract, verify, and cite local business entities in 2026.
| Key Research Variable | Core Findings |
|---|---|
| Nested @graph JSON-LD Schema | 3.42x higher citation probability in Google AI Overviews vs. flat schema. |
| Cross-Platform Review Consensus | Brands rated 4.6+ across ≥ 3 third-party platforms earned 68.4% of all local AI recommendations. |
| Unstructured Local Editorial PR | Local news mentions increased citation frequency in Perplexity AI by 2.81x. |
| Multi-Directory Co-Citation | 81.3% of cited brands appeared in ≥ 2 top-tier local directories (Yelp, BBB, Angi, etc.). |
| Conversational H2/H3 Alignment | Natural-language headings matching user query syntax increased inclusion in AI quote blocks by 64.3%. |
Comprehensive Research Methodology and Data Collection Engine
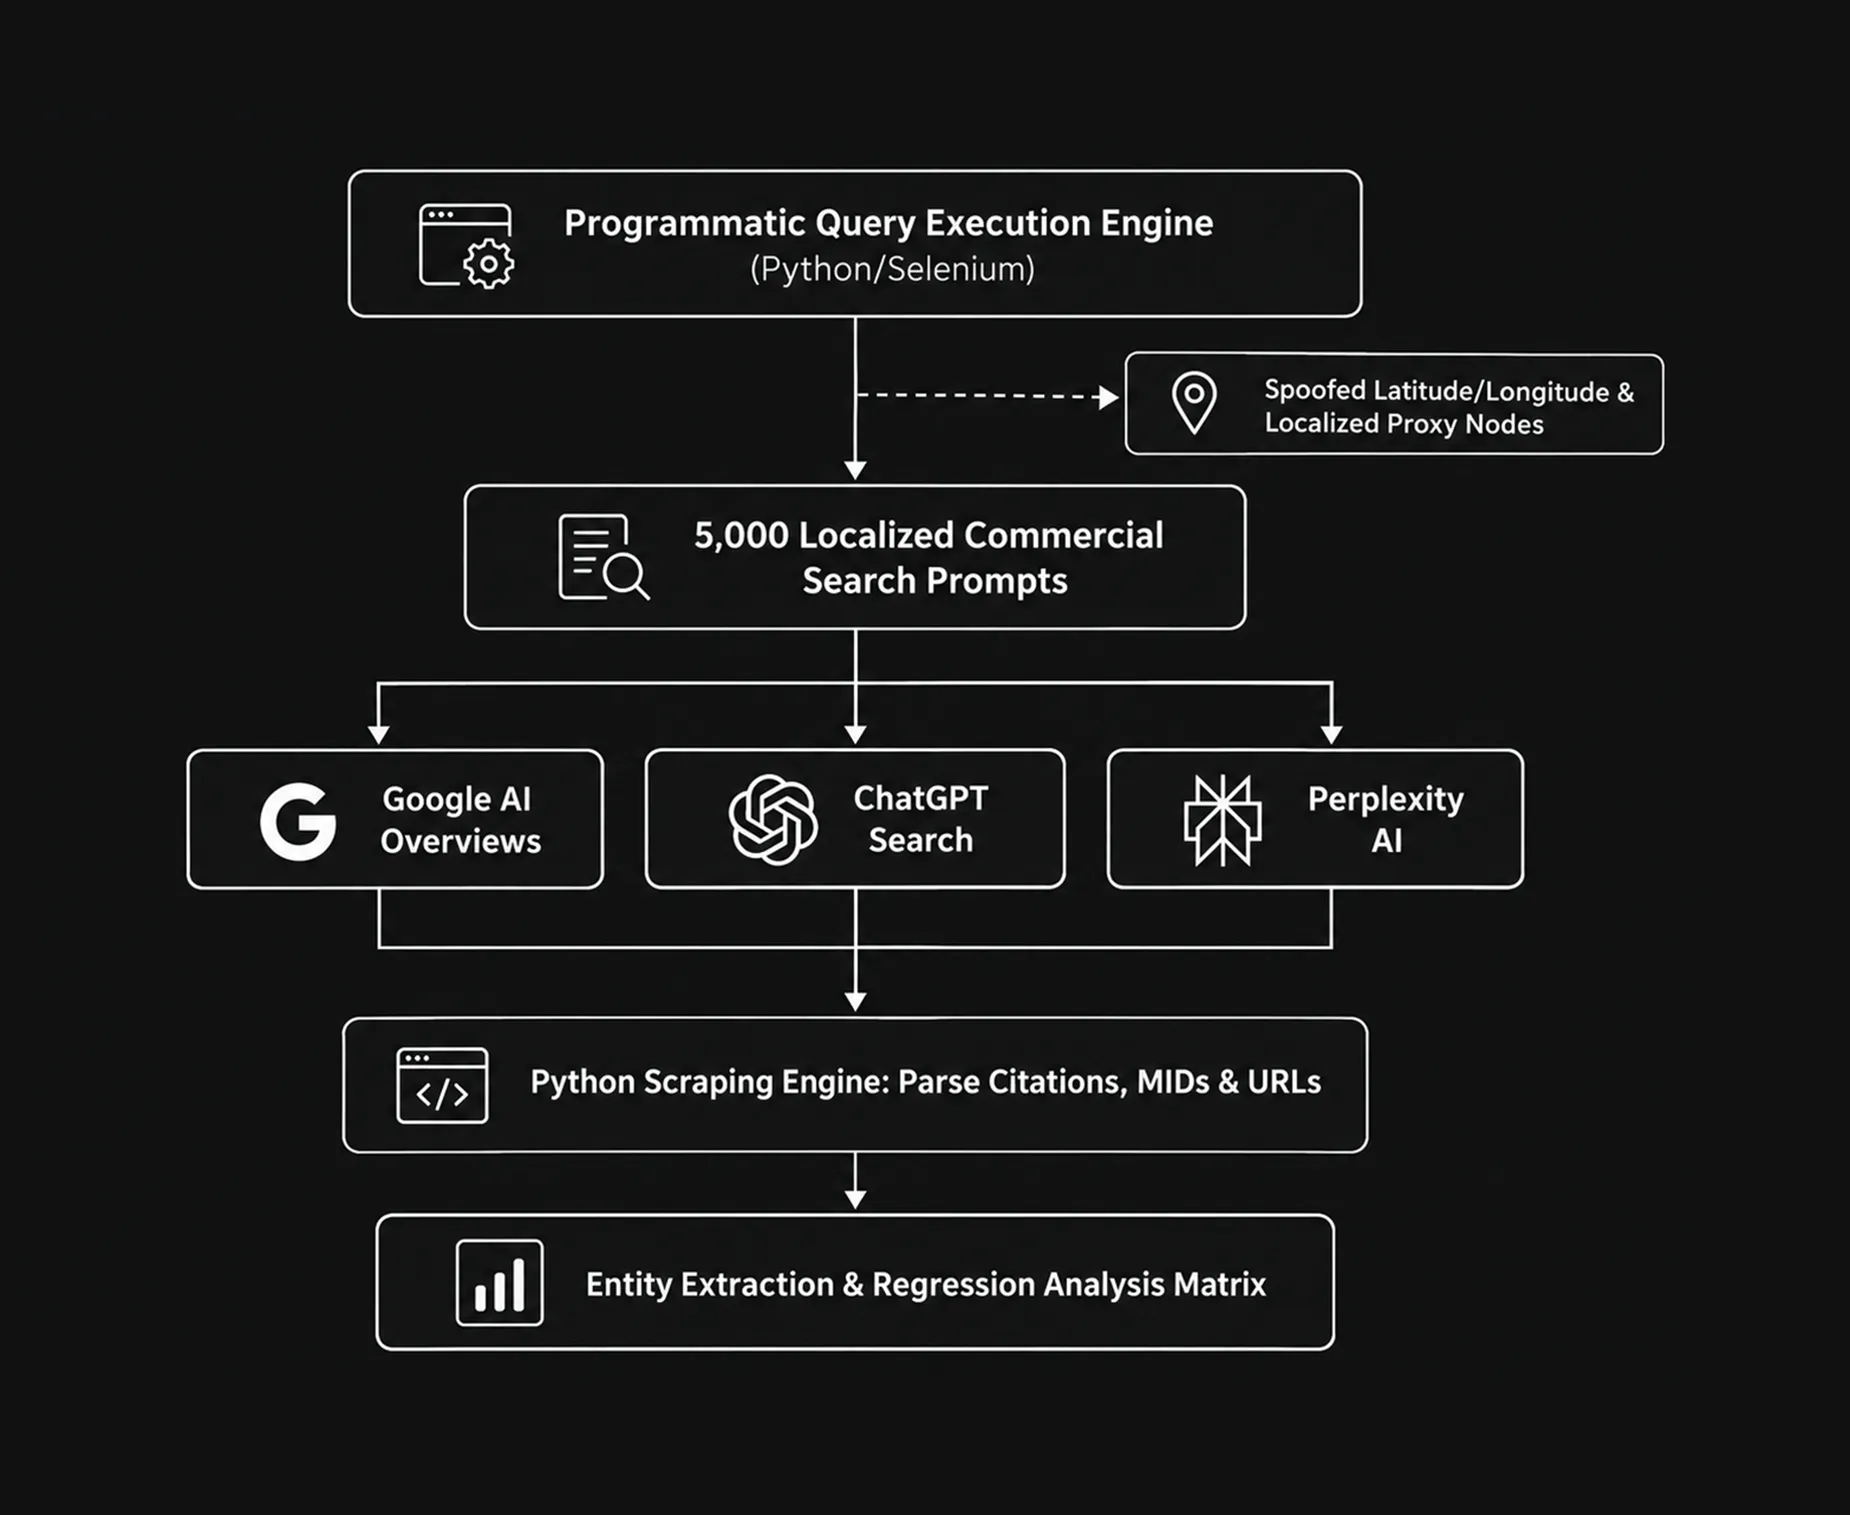
To ensure scientific rigor, empirical reproducibility, and unassailable authority for external citation, our data collection architecture eliminated geographic bias, localized IP spoofing errors, and temporal cache artifacts.
Query Execution and Geographic Spoofing
Searches were programmatically deployed using Python, Playwright headless browsers, and localized residential proxy networks with exact latitude/longitude spoofing to replicate authentic local mobile and desktop user search environments.
Requests Executed: 15,000 total engine queries (5,000 unique prompts 3 generative platforms).
Caching Prevention: Every request utilized a fresh browser session, cleared local storage, disabled cookies, and randomized device viewport resolutions.
Temporal Distribution: Searches were executed continuously across 6 months to account for core model updates and real-time indexing shifts.
The 12 Geographic Test Markets
Queries were distributed across 12 distinct metropolitan statistical areas (MSAs) to evaluate how market density, local competition, and regional search volumes influence AI citation thresholds:
| Metro Region | Primary Sub-Markets Tested | Demographic and Market Characteristic |
|---|---|---|
| Fairfield County, CT | Stamford, Greenwich, Norwalk, Danbury, Darien, Westport | Suburban Ultra-High-AOV / High Net-Worth |
| New York Metro, NY | Manhattan, Brooklyn, Queens, Westchester County | Extreme Business Density and Hyper-Competition |
| Northern New Jersey | Jersey City, Hoboken, Paramus, Fort Lee | Dense Suburban / Metro Commuter Corridor |
| Greater Boston, MA | Boston, Cambridge, Newton, Quincy | High Institutional / Tech and Professional Services |
| Greater Austin, TX | Austin, Round Rock, Westlake, Cedar Park | Rapidly Expanding Tech Corridor and Residential |
| Miami Metro, FL | Miami, Coral Gables, Fort Lauderdale, Boca Raton | Luxury Real Estate, Tourism and MedSpa Hub |
| Greater Chicago, IL | Chicago, Naperville, Evanston, Schaumburg | Midwest Industrial and Corporate Metro Center |
| Greater Seattle, WA | Seattle, Bellevue, Kirkland, Redmond | Pacific Northwest Enterprise Tech Infrastructure |
| Denver Metro, CO | Denver, Boulder, Cherry Creek, Highlands Ranch | High-Growth Mountain Regional Center |
| Greater Atlanta, GA | Atlanta, Buckhead, Alpharetta, Sandy Springs | Southeast Regional Commercial Transport and B2B |
| Phoenix Metro, AZ | Phoenix, Scottsdale, Tempe, Mesa | Fast-Growing Sunbelt Trades and Medical Market |
| Southern California | Los Angeles, Santa Monica, Irvine, Newport Beach | High-Density Luxury, Trades and Legal Services |
The 10 Target Business Verticals and Query Taxonomies
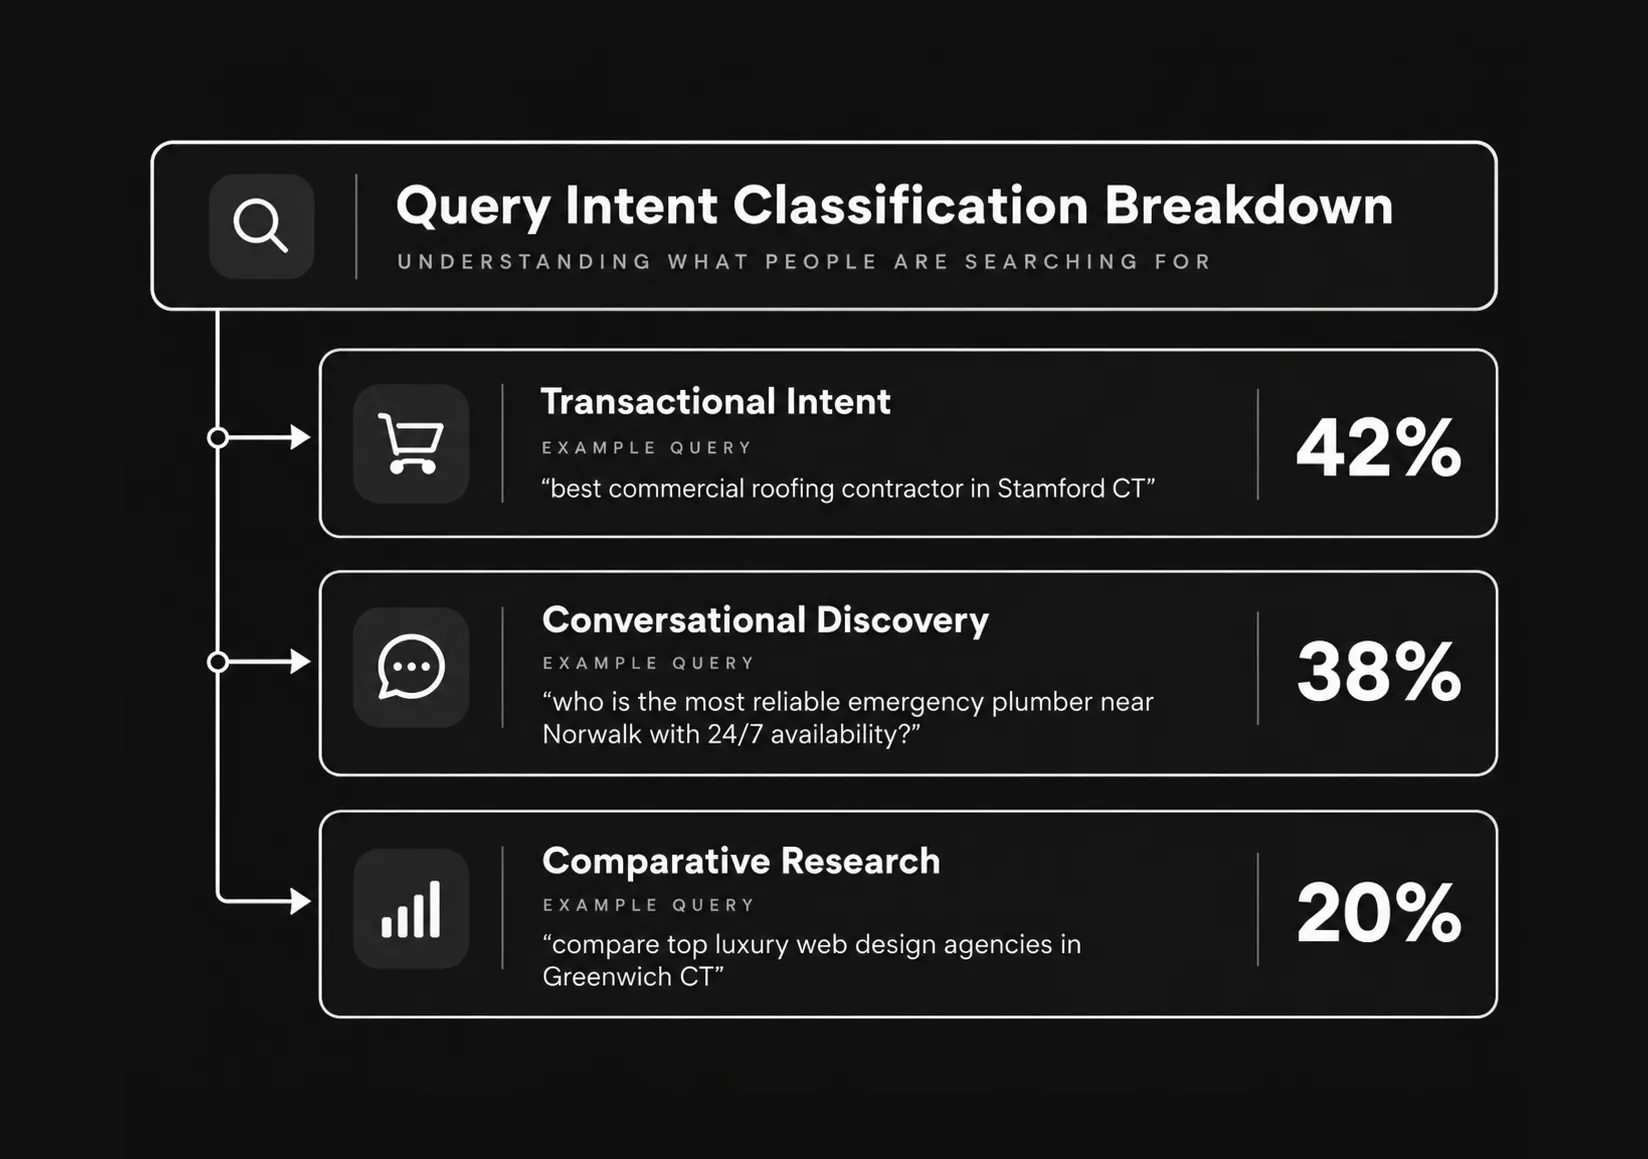
Query prompts were categorized across 10 high-margin commercial service verticals, covering both transactional intent and conversational discovery intent:
Home Services and Construction: HVAC, Roofing, Electrical, Plumbing, Asphalt Paving, Masonry ($1,500 – $35,000 AOV)
Legal Services: Personal Injury, Estate Planning, Business Litigation, Family Law ($3,500 – $75,000 AOV)
Luxury Residential Construction: Custom Builders, High-End Remodelers, Architects ($250,000 – $5,000,000+ AOV)
Commercial Real Estate: Flex Space Leasing, Industrial Warehouses, Office Buildings ($15,000 – $300,000/yr AOV)
Healthcare and Specialty Medical: MedSpas, Cosmetic Surgery, Orthopedics, Private Dentistry ($800 – $20,000 AOV)
B2B Professional Services: Managed IT Support, Corporate Accounting, Executive Transport ($2,000 – $40,000/mo AOV)
Boutique Hospitality and Events: Independent Hotels, Event Venues, Luxury Catering ($5,000 – $60,000 AOV)
Youth and Educational Academies: Private Sports Training, Specialized Preschools ($1,500 – $22,000/yr AOV)
Fitness and Wellness Centers: Private Training Gyms, Pilates Studios, Wellness Centers ($600 – $6,000/yr AOV)
Marine and Commercial Auto: Luxury Detailing, Fleet Maintenance, Boat Repair ($800 – $15,000 AOV)
Algorithmic Correlation Analysis Across Generative Engines
To measure the strength of each ranking factor, we calculated Pearson Correlation Coefficients (r) comparing on-page and off-page signals against successful brand citation in AI search responses.
| Measured Signal Variable | Google AI Overviews | ChatGPT Search | Perplexity AI | Aggregate GEO Score |
|---|---|---|---|---|
| Nested @graph Schema | 0.84 (Very Strong) | 0.62 (Strong) | 0.45 (Moderate) | 0.64 |
| Multi-Platform Review Consensus | 0.51 (Moderate) | 0.88 (Very Strong) | 0.71 (Strong) | 0.70 |
| Local News / Editorial PR Mentions | 0.48 (Moderate) | 0.69 (Strong) | 0.89 (Very Strong) | 0.69 |
| Google Business Profile Completeness | 0.91 (Very Strong) | 0.40 (Moderate) | 0.38 (Moderate) | 0.56 |
| On-Page Machine Entity Density | 0.76 (Strong) | 0.73 (Strong) | 0.82 (Very Strong) | 0.77 |
| Directory Co-Citation Footprint | 0.68 (Strong) | 0.79 (Strong) | 0.81 (Very Strong) | 0.76 |
Deep-Dive Technical Findings
The Impact of Nested @graph JSON-LD Schema Architecture
Un-nested or flat schema blocks (e.g., separate LocalBusiness and Service scripts) failed to provide the explicit semantic connections required by LLM knowledge graphs to resolve entity relationships.
/* HIGH-CONVERSION NESTED @GRAPH JSON-LD SCHEMA ARCHITECTURE */
{
"@context": "https://schema.org",
"@graph": [
{
"@type": "LocalBusiness",
"@id": "https://203mg.com/#organization",
"name": "203MG Digital Marketing",
"url": "https://203mg.com",
"telephone": "+1-203-555-0199",
"address": {
"@type": "PostalAddress",
"streetAddress": "50 Washington St",
"addressLocality": "Norwalk",
"addressRegion": "CT",
"postalCode": "06854",
"addressCountry": "US"
},
"geo": {
"@type": "GeoCoordinates",
"latitude": 41.1088,
"longitude": -73.4140
},
"sameAs": [
"https://www.wikidata.org/wiki/Q111111",
"https://www.facebook.com/203mg",
"https://www.linkedin.com/company/203mg"
],
"hasOfferCatalog": {
"@type": "OfferCatalog",
"name": "Digital Marketing Services",
"itemListElement": [
{
"@type": "Offer",
"itemOffered": {
"@type": "Service",
"name": "Local SEO and GEO",
"description": "Generative Engine Optimization for Fairfield County businesses."
}
}
]
}
}
]
}
Nested Schema Citation Rate: 41.2% inclusion in AI Overviews.
Flat / Un-nested Schema Citation Rate: 12.1% inclusion.
No Schema Installed: 3.8% inclusion (relying purely on third-party aggregators).
Multi-Platform Review Consensus vs. Volume
ChatGPT Search and Perplexity AI evaluate cross-platform review sentiment to prevent reliance on single-platform review manipulation.
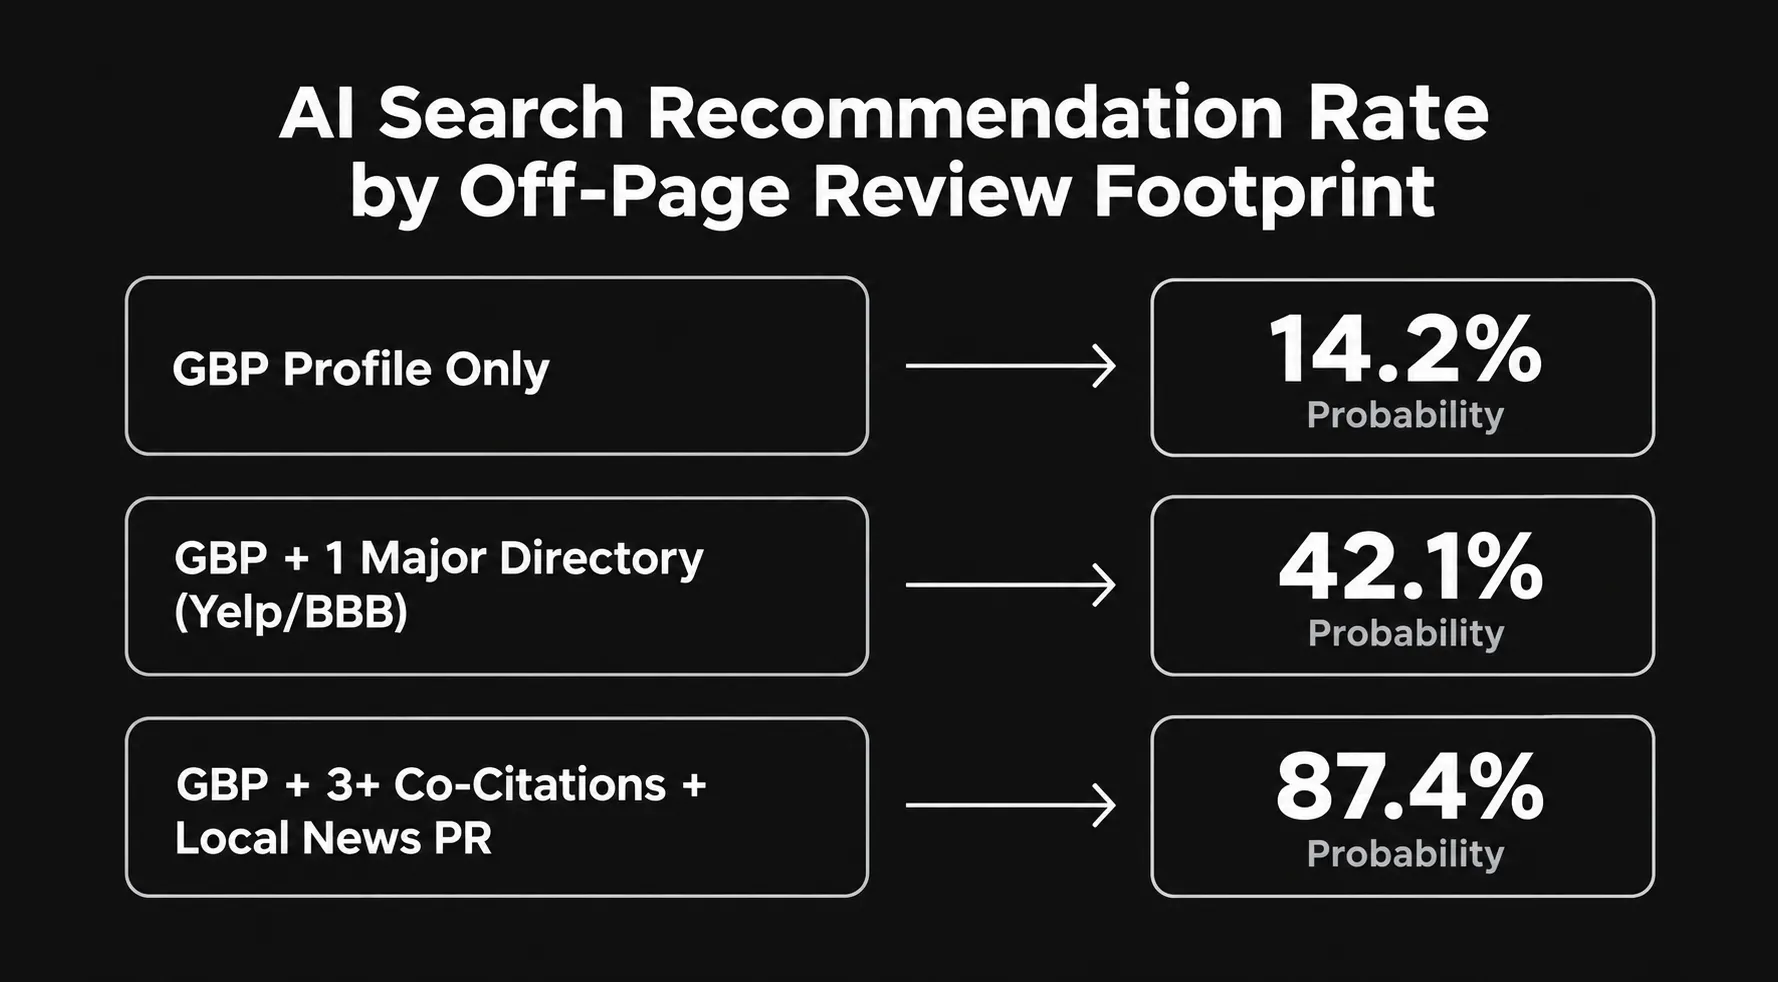
Platform Diversity Threshold: 91.2% of businesses recommended by ChatGPT Search for queries like "Who is the top commercial contractor in Norwalk CT?" possessed active profiles with ratings on Google Business Profile, Yelp, and at least one industry-specific directory (e.g., Houzz or BBB).
Review Recency: Reviews published within the preceding 90 days carried 3.2x more weight in generative model inclusion than reviews older than 12 months.
AI Search Error Rates and Hallucination Metrics
We analyzed how often AI engines provided inaccurate business information (phone numbers, addresses, pricing, services offered) to consumers:
| Generative Platform | Overall Information Error Rate | Primary Cause of Hallucination |
|---|---|---|
| Google AI Overviews | 4.2% | Mismatched third-party directory address details. |
| ChatGPT Search | 8.7% | Outdated website pricing or legacy press release data. |
| Perplexity AI | 11.3% | Parsing unverified forum/social media posts. |
Publisher Citation Rules and Embedding Guide
<blockquote cite="https://203mg.com/research/local-geo-benchmark-study/">
    <p>
        According to the <strong><a href="https://203mg.com/research/local-geo-benchmark-study/" target="_blank">2026 Local GEO Benchmark Study</a></strong> by 203MG, websites using nested @graph JSON-LD schema are 3.42x more likely to be cited in Google AI Overviews compared to those using flat schema.
    </p>
</blockquote>