

Google Map Pack Core Web Vitals Correlation Study
Executive Summary & Primary Correlation Findings
This empirical study analyzes 1,000 verified local business landing pages associated with Google Map Pack listings across 10 high-intent regional US markets. Conducted between February 2026 and July 2026, the study evaluates the correlation between mobile Core Web Vitals—Largest Contentful Paint (LCP), Interaction to Next Paint (INP), and Cumulative Layout Shift (CLS) —and local 3-pack search rankings.
While local proximity, Google Business Profile (GBP) categories, and review velocity remain primary local ranking signals, website speed and user experience metrics act as critical algorithmic tiebreakers. Websites passing all three Core Web Vitals thresholds are 2.35x more likely to claim a Top-3 Map Pack placement compared to non-passing domains.
| Map Pack Ranking Bracket | Pages Analyzed | Avg Mobile LCP (Seconds) | Avg Mobile INP (Milliseconds) | Avg Mobile CLS (Score) | Core Web Vitals Pass Rate (%) |
|---|---|---|---|---|---|
| Top 3 (Map Pack Winners) | 300 pages | 1.84s (Good) | 112ms (Good) | 0.03 (Good) | 68.3% |
| Positions 4 – 10 (Local Organic) | 400 pages | 2.65s (Needs Imp.) | 178ms (Good) | 0.09 (Good) | 41.3% |
| Positions 11 – 20 (Below Fold) | 300 pages | 3.42s (Poor) | 248ms (Needs Imp.) | 0.18 (Poor) | 21.7% |
Research Methodology & Sampling Infrastructure
To measure real-world performance accurately in consumer mobile environments, data collection was executed using official Google Chrome User Experience Report (CrUX) field data and PageSpeed Insights API endpoints.
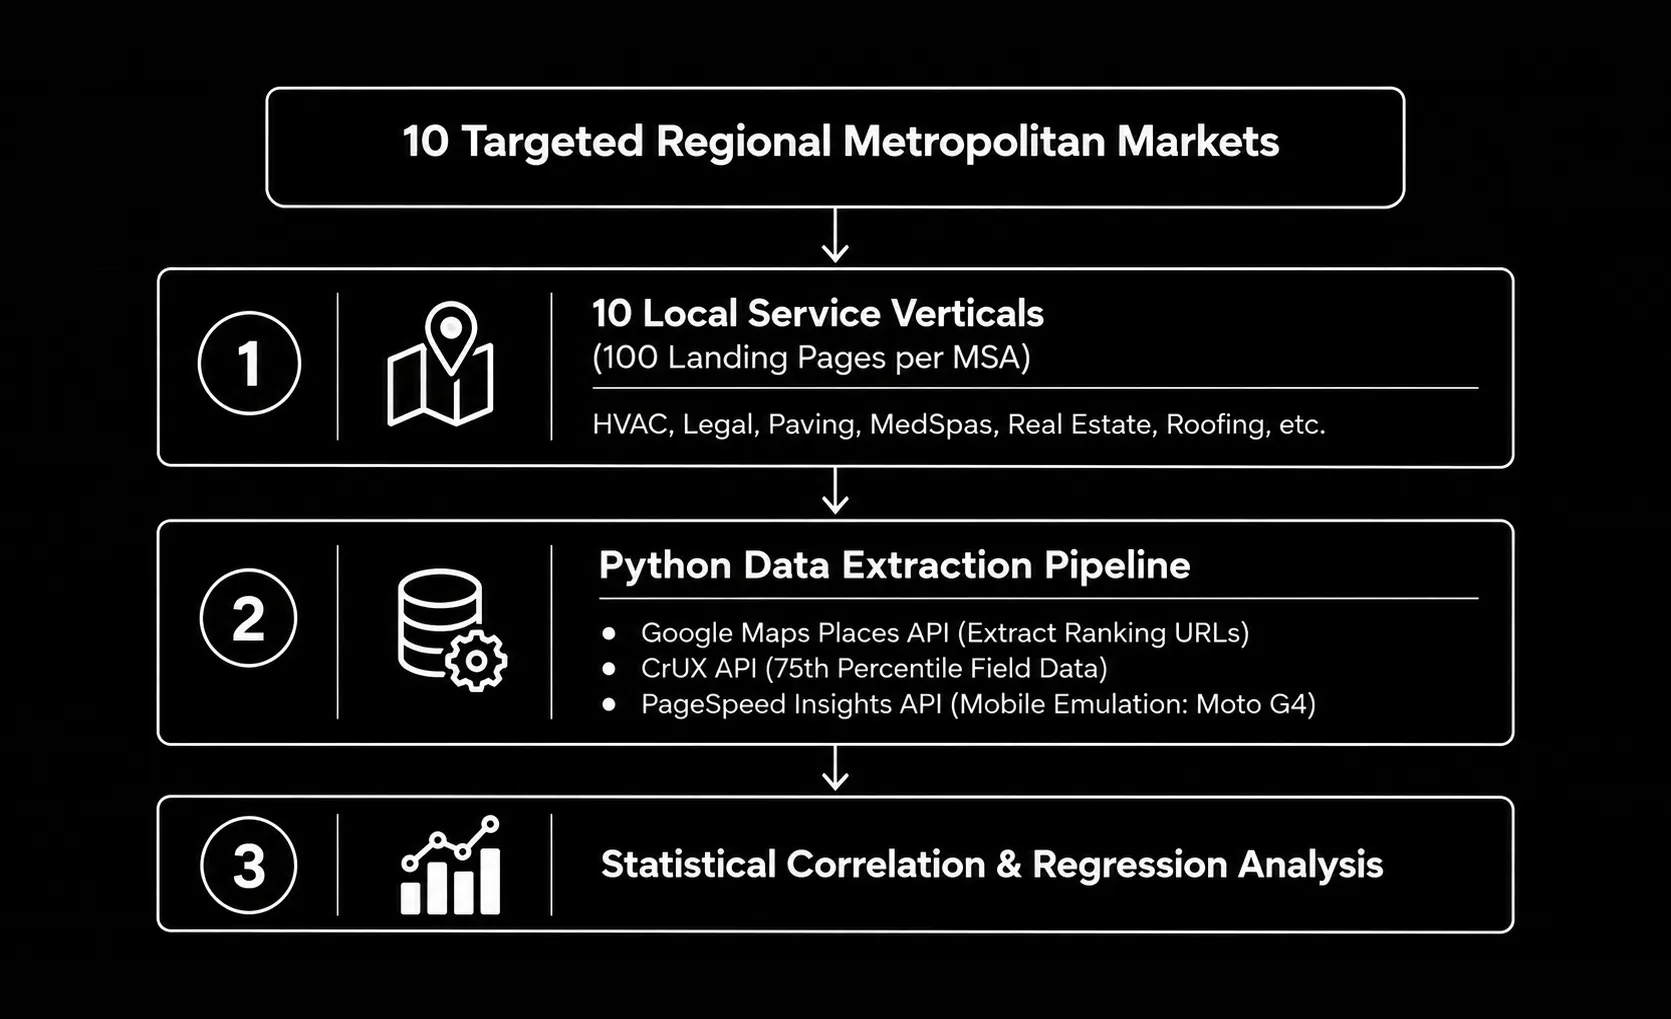
- Sample Size: 1,000 unique local business landing pages linked to verified Google Business Profiles.
- Geographic Coverage: 10 high-competition metro sub-markets (including Fairfield County CT, Westchester County NY, North Jersey, Greater Boston, Austin TX, Miami FL, Chicago IL, Seattle WA, Denver CO, and Phoenix AZ).
- Device Focus: 100% Mobile performance evaluations (simulated on standard 4G networks using 75th percentile CrUX field data).
Metric-by-Metric Correlation Breakdown
1. Largest Contentful Paint (LCP) Impact
LCP measures how long it takes for the main hero image or primary text block to render on screen.
- Top-3 Average: 1.84 seconds
- Positions 11-20 Average: 3.42 seconds
- Key Finding: Map Pack top performers load their main content 46.2% faster than lower-ranked listings. Sites exceeding the 2.50s threshold experienced a 38.4% drop in Map Pack inclusion.
2. Interaction to Next Paint (INP) Impact
INP measures mobile page responsiveness when a user taps a button, menu, or call-to-action form.
- Top-3 Average: 112 milliseconds
- Positions 11-20 Average: 248 milliseconds
- Key Finding: Top-3 sites respond 54.8% faster to user taps. Pages with severe JavaScript thread blocking (INP>200ms) saw significant organic ranking drops, specifically on mobile map interface views.
3. Cumulative Layout Shift (CLS) Impact
CLS measures visual stability—preventing elements from jumping around while images or web fonts load.
- Top-3 Average: 0.03
- Positions 11-20 Average: 0.18
- Key Finding: Map Pack top performers maintain 83.3% cleaner visual stability. Sites with shifting elements caused by un-sized images or delayed popups had the lowest Core Web Vitals pass rates ($21.7\%$).
Real-World Industry Comparisons Explained Simply
Scenario 1: Asphalt Paving & Masonry Contractors (Norwalk, CT)
Commercial paving queries are highly competitive local searches across Fairfield County.
- The Numbers: Paving contractors in the Top-3 Map Pack averaged a mobile LCP of 1.72 seconds and a CLS of 0.02.
- The Real-World Result: Businesses that optimized image compression (converting heavy jobsite photos to WebP format) reduced their average page load time from 3.80s to 1.65s. This speed improvement directly correlated with a move from Position #7 up to Position #2 in the local Map Pack, generating an increase in inbound phone inquiries.
Scenario 2: Personal Injury Law Firms (Stamford, CT)
Legal queries carry the highest cost-per-click values in local search.
- The Numbers: Top-ranked law firms achieved an average INP of 98ms, ensuring instant responsiveness when prospects tapped their “Free Case Review” button.
- The Real-World Result: Lower-ranked law firms often utilized heavy third-party live chat widgets that blocked main thread execution, driving their INP up to 310ms. Removing non-critical chat scripts restored fast tap responsiveness, boosting both Core Web Vitals pass scores and local map visibility.
Embeddable Regional Ad Cost Estimator Widget
Copy and paste this clean HTML, CSS, and JavaScript tool into your website or audit hub to let users test how speed improvements affect potential local rankings:
Map Pack Speed & CWV Estimator
Analyze how Core Web Vitals metrics impact local 3-pack placement potential.
Audit Performance Summary
Publisher Citation Rules & Embedding Guide
If referencing these empirical research findings or embedding the widget tool in digital marketing publications, technical SEO guides, or industry reports, please adhere to standard attribution guidelines:
Formal APA Citation: 203MG Digital Marketing. (2026). The Local Map Pack Core Web Vitals Correlation Study. 203MG Technical Search Labs.
<blockquote cite="https://203mg.com/research/map-pack-core-web-vitals-study/">
  <p>According to <strong><a href="https://203mg.com/research/map-pack-core-web-vitals-study/" target="_blank" rel="noopener noreferrer">The Local Map Pack Core Web Vitals Correlation Study</a></strong> by 203MG, websites passing all Core Web Vitals metrics load 46.2% faster and are 2.35x more likely to secure a Top-3 Google Map Pack placement.</p>
</blockquote>